

Understanding Qutex: A Clear Guide
Explore Qutex in detail 📘 Learn about its technology, applications across fields, and future prospects in this comprehensive guide for curious minds.
Edited By
Sophia Bennett
The Average Directional Index (ADX) is a popular technical indicator used by traders and investors to measure the strength of a trend in the stock market. Unlike some indicators that focus only on price direction, ADX helps you understand whether a market is trending strongly or moving sideways.
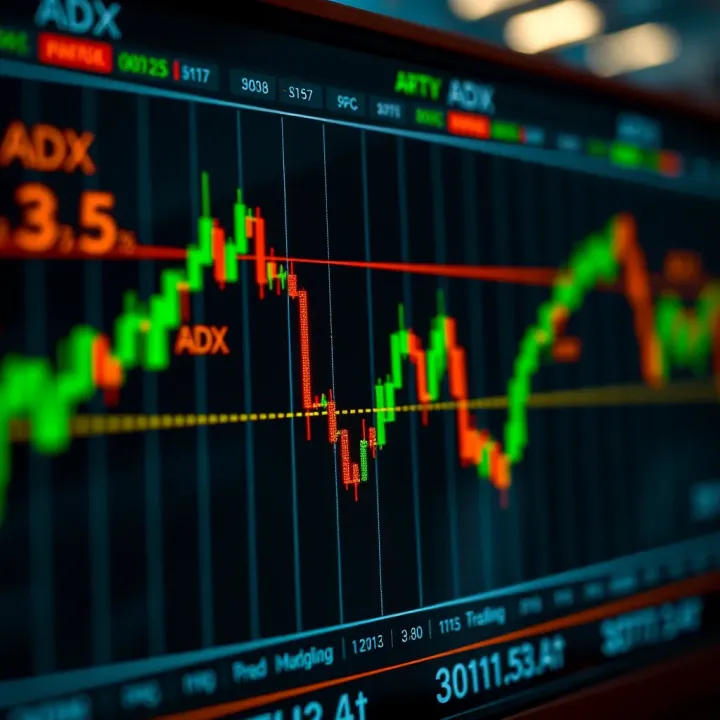
ADX values range from 0 to 100. A low ADX (below 20) usually means the market is without a clear trend, often moving sideways or with low volatility. When the ADX rises above 25 or 30, it signals a strong trend, whether upward or downward. However, ADX itself does not indicate the direction of the trend; it just measures its intensity.
The ADX is derived from the Directional Movement Index (DMI), which consists of two lines: +DI (Positive Directional Indicator) and –DI (Negative Directional Indicator). These lines help identify whether the bulls (buyers) or bears (sellers) are dominating the market. The ADX smooths the difference between these two lines to assign a strength value.
Consider an investor tracking the Nifty 50 index. If the ADX rises above 30, it suggests a strong trend is developing, and the trader might choose to enter trades aligned with the trend, such as buying in a strong uptrend or short selling in a downtrend. Conversely, when ADX falls below 20, the trader may avoid trend-based strategies and focus on range trading or wait for clearer signals.
Remember, ADX is best used alongside other indicators or price action analysis to determine entry and exit points effectively.
Helps avoid false breakouts by showing when trends lack strength
Assists in confirming trend reversals when combined with +DI and –DI
Useful across timeframes—from intraday trading to long-term investing
ADX does not specify trend direction—requires reading alongside DI lines
Can lag during sudden market moves because it uses smoothed data
In summary, the ADX indicator offers a straightforward way to gauge trend strength, empowering Indian traders and investors to make more informed decisions in volatile markets like NSE or BSE. Applying ADX with a clear understanding and combining it with other tools improves trading accuracy significantly.
The Average Directional Index (ADX) is a key tool used by traders and analysts to measure the strength of a trend in financial markets. It doesn't show the direction of the trend, but rather how strong it is. This makes ADX particularly helpful in deciding if the market is trending strongly or moving sideways, which can impact trading strategies. For example, in the Indian stock market, if ADX rises above 25, it often indicates a strong trend, which traders might want to follow.
ADX, हिंदी में मतलब होता है "औसत दिशात्मक सूचकांक"। इसका काम बाज़ार में चल रहे ट्रेंड की ताकत को मापना होता है। मतलब अगर शेयर या कोई भी वित्तीय उपकरण ऊपर-नीचे हो रहा है, तो ADX बताता है कि वो उतना ही मजबूत है या नहीं। यह सूचकांक 0 से लेकर 100 तक की सीमा में होता है, जहाँ 20-25 से कम मानोतारी दिशा की कमजोरी को दिखाता है और 25 से ऊपर मजबूत ट्रेंड को संकेत करता है।
टेक्निकल एनालिसिस में ADX की भूमिका बहुत अहम है क्योंकि ये निवेशकों को मार्केट के मूवमेंट की स्पष्ट तस्वीर देता है। उदाहरण के तौर पर, जब आप देखते हैं कि ADX का मान 30 के ऊपर है, तो इसका मतलब है कि या तो तेजी का ट्रेंड है या मंदी का, लेकिन वो स्थिर है। वहीं, जब ADX 20 के नीचे है, तो बाजार में ज्यादा कीमत की दिशा की अनिश्चितता होती है, और यह फंसा हुआ या रेंज में चलने वाले बाजार की ओर संकेत कर सकता है।
ADX को पहली बार J. Welles Wilder Jr. ने 1978 में पेश किया था, जो एक अनुभवी टेक्निकल एनालिस्ट थे। उन्होंने ADX के साथ ही कई दूसरे इंडिकेटर्स जैसे RSI (Relative Strength Index) भी बनाए। Wilder ने इस इंडिकेटर को इस विचार के साथ बनाया कि निवेशकों को बाजार की दिशा से ज्यादा उसकी ताकत को समझना चाहिए ताकि वे बेहतर ट्रेडिंग निर्णय ले सकें।
आज के समय में, ADX विभिन्न ट्रेडिंग प्लेटफॉर्म्स पर आसानी से उपलब्ध है और इसका प्रयोग न सिर्फ शेयर बाजार में बल्कि कमोडिटी, मुद्रा विनिमय ( forex), और क्रिप्टोकरेंसी ट्रेडिंग में भी किया जाता है। भारतीय बाजार में भी कई ट्रेडर्स ADX को अपनी तकनीकी रणनीति में शामिल करते हैं क्योंकि यह तेज़ और धीमे ट्रेंड्स दोनों की पहचान करवा सकता है। उदाहरण के लिए, अगर आप निफ्टी इंडेक्स के ट्रेडर हैं, तो ADX की मदद से आप यह तय कर सकते हैं कि कब पोजीशन लेनी है और कब बाजार में स्थिरता बनी हुई है, जिसे देखने पर ट्रेड से बचना बेहतर होता है।
ADX खुद घोषणा नहीं करता कि बाजार ऊपर जाएगा या नीचे, बल्कि ये तय करता है कि ट्रेंड कितना मजबूत है — जो ट्रेडिंग में एक अहम जानकारी है।
Knowing how the Average Directional Index (ADX) is calculated helps traders understand the strength of market trends rather than just spotting their presence. ADX isn’t a standalone number pulled from thin air; it’s the result of detailed steps combining price movements and smoothing techniques. This section breaks down the math behind ADX for clarity and practical use.
The core of the ADX lies in two components: +DI and -DI. They measure upward and downward price movements separately. For example, if today's high is higher than yesterday's, the positive directional movement (+DM) increases; if today’s low is lower than yesterday’s, negative directional movement (-DM) goes up. These help decide whether bulls or bears dominate.

By comparing these +DM and -DM values against the True Range (which we’ll discuss shortly), we get +DI and -DI percentages. They reveal directionality, showing if prices are generally moving up or down.
Raw +DI and -DI values can be jagged, causing noise in trading signals. So, smoothing them out is essential. Wilder, who created ADX, used a type of exponential moving average to smooth these values over a specific 'period' — usually 14 days.
This smoothing brings stability to ADX, enabling it to reflect trend strength without reacting to every small price twitch. For Indian markets, where daily volatility can be sharp, smoothing avoids whipsaws that might confuse traders.
True Range (TR) measures volatility and forms the base for the directional indicators. It’s calculated by taking the greatest of these three:
Current high minus current low
Absolute value of current high minus previous close
Absolute value of current low minus previous close
This method captures gaps and limits overlooking price fluctuations within or between sessions.
Directional Movement compares the difference between consecutive days’ highs and lows:
+DM = Today’s high minus yesterday’s high (if positive and greater than -DM)
-DM = Yesterday’s low minus today’s low (if positive and greater than +DM)
If neither is positive or one is lesser, the movement is ignored for that day. This prevents double counting.
Once you have smoothed +DI and -DI, the Directional Movement Index (DX) is calculated as:
[ ]
This indicates how far apart the directional strengths are.
Finally, ADX is the smoothed average of DX over the chosen period. ADX doesn’t show trend direction, only strength — a higher ADX means a stronger trend whether up or down.
Understanding these calculations provides confidence to traders using ADX, helping to trust signals instead of second guessing.
By grasping How ADX is Calculated, Indian traders can better tune their charts, customise settings for local market conditions, and avoid pitfalls like chasing weak trends.
Interpreting ADX (Average Directional Index) values helps traders understand the strength of a market trend, which is key to making better trading decisions. Unlike other indicators that show direction, ADX focuses on how strong the trend is, whether rising or falling.
The ADX value ranges from 0 to 100, with specific thresholds indicating trend intensity. Generally, a reading below 20 means the market is weakly trending or moving sideways. Between 20 and 40 signals a strong trend, while above 40 indicates a very strong trend. For example, if the ADX is around 35 on the Nifty 50 index, it suggests a firm upward or downward trend, signalling traders to either hold positions or consider trend-following strategies.
Knowing these thresholds is helpful because it prevents chasing moves that lack momentum. If the ADX is below 20, it's better to avoid trend-based trades since the market is likely ranging.
When it comes to spotting whether the market is trending or ranging, ADX alone does not reveal direction but the trend's presence. When ADX rises above 20, it shows a trend is gaining traction. Below that, it reflects a range-bound or consolidating market. For instance, during monsoon months, Indian equity markets may move sideways; a low ADX confirms this, helping traders avoid false trend signals.
Besides the ADX line, Directional Indicators (+DI and -DI) show trend direction. A buy signal arises when +DI crosses above -DI along with a rising ADX, indicating the start or continuation of an uptrend. Conversely, when -DI is above +DI with a high ADX, it suggests a downtrend, signalling selling or shorting opportunities.
These crossover points combined with ADX readings help you enter trades with the market's real momentum. For example, if Reliance Industries shows +DI crossing above -DI and ADX moving past 25, it might be a cue to buy.
However, false signals occur when DI lines cross too frequently in choppy markets or when ADX is low. To avoid this, traders should wait for ADX to confirm trend strength before reacting. Also, combining ADX with other indicators like RSI or moving averages reduces chances of whipsaws or misleading trades.
Always remember: ADX tells you how strong a trend is, while +DI and -DI help identify its direction. Using them together improves trade timing and confidence.
Interpreting ADX values correctly can save you from entering weak trend trades, help identify moments to stay on course, and avoid losses from false breakouts in the Indian market.
Knowing how to use the Average Directional Index (ADX) properly can improve your trading decisions significantly. This section focuses on practical tips that help you apply ADX effectively, especially in the diverse conditions of Indian markets. Instead of relying on ADX alone, combining it with other tools and setting its parameters thoughtfully can give clearer trading signals and reduce mistakes.
Moving averages (MA) are popular trend-following indicators that smooth out price data to help identify market direction. When combined with ADX, moving averages can confirm the trend strength that ADX indicates. For example, if the ADX shows a strong trend above 25 and the price is above the 50-day moving average, it suggests a reliable bullish trend. This dual confirmation can boost confidence before entering trades.
Using simple or exponential moving averages alongside ADX also helps filter false signals. In a choppy market, if ADX is low but price crosses the moving average, you might avoid trading or wait for ADX to confirm a stronger trend.
Relative Strength Index (RSI) and Moving Average Convergence Divergence (MACD) are momentum indicators often used with ADX to gauge entry and exit points. RSI measures overbought or oversold conditions, so if ADX signals a strong trend and RSI is not in an extreme zone, the trend may continue. Conversely, an RSI above 70 during a strong ADX uptrend might warn of an upcoming correction.
MACD shows changes in momentum through the interaction of moving averages. When MACD crosses align with a rising ADX, it confirms the momentum backing the trend. For instance, if ADX rises above 25 indicating trend strength while MACD histogram bars grow, you get a clearer buy/sell signal.
Selecting the right time frame depends on your trading style. For day traders in Indian markets like the NSE or BSE, a 14-period ADX on 15-minute charts can capture short-term trends effectively. Swing traders might prefer daily charts with the same period for broader movements. Adjusting the period to suit the time horizon can make ADX readings more relevant.
Remember, Indian markets often have distinct volatility during opening and closing hours, so shorter periods could react better to these changes. For weekly investors, longer time frames give a smoother trend view but with delayed signals.
Volatility in Indian markets can vary widely, especially during festive seasons or global events. Standard ADX settings use a 14-period, but tweaking this helps capture different volatility levels. For volatile stocks like ITC or Tata Motors, shorter ADX periods (around 10) can make the indicator more responsive.
On the other hand, for stable sectors like FMCG, longer periods (20 or more) can avoid whipsaws and false signals. The key is to backtest and observe how different ADX periods perform on your chosen stocks or indices, then settle on what balances sensitivity and stability best.
Using ADX alongside other indicators and adjusting its settings for specific market conditions can significantly improve your trading accuracy and help avoid common pitfalls.
The Average Directional Index (ADX) is a valuable tool for measuring trend strength, but relying solely on it can lead to costly errors in trading. Understanding the common mistakes and inherent limitations of ADX helps traders avoid pitfalls and make better-informed decisions.
The ADX indicator measures trend strength but does not indicate the trend's direction or broader market conditions. Traders who depend only on ADX values without considering price action, volume, or news often miss crucial signals. For example, a rising ADX value suggests a strong trend, but if the market faces major geopolitical announcements, the trend could abruptly reverse despite the ADX reading. Ignoring such context can lead to entering trades too late or holding losing positions unnecessarily.
ADX tends to give low readings during sideways or consolidating markets but can also produce misleading spikes. For instance, small price fluctuations within a range might momentarily boost the ADX, prompting traders to think a new trend is forming. Such false signals can cause premature entries or exits. Recognising this, traders should combine ADX with other tools to confirm market direction before acting, especially in choppy or range-bound phases common in Indian equities or commodities during uncertain periods.
ADX is a smoothed moving average of directional movement, which means it naturally lags behind price action. This smoothing reduces noise but also delays signals. When a new trend starts, ADX may take several periods to indicate increasing strength, which can cause traders to miss early moves. For example, in fast-moving markets like currency trading around RBI policy announcements, this delay might lead to late entries that reduce profit potential.
To overcome ADX lag, traders combine it with leading indicators or price-based strategies. For instance, pairing ADX with Relative Strength Index (RSI) or Moving Averages can provide earlier directional clues. RSI can highlight overbought or oversold conditions before the trend gains strength, while moving averages track price momentum changes more promptly. Using these tools together helps confirm ADX signals and improves timing, reducing the risk of acting on delayed information.
Always remember, ADX shows how strong a trend is but does not say which way the market will move. Consider the bigger picture and use supporting tools to avoid costly mistakes.
Don’t trade only on ADX readings; always look at price and volume.
Be cautious of ADX spikes during low volatility phases.
Use combinations like ADX with RSI or moving averages for better signal confirmation.
Understanding these limits can make ADX a more reliable part of your trading toolkit in Indian markets and beyond.
Explore Qutex in detail 📘 Learn about its technology, applications across fields, and future prospects in this comprehensive guide for curious minds.

Learn how to smoothly withdraw funds from Quotex 💰 with clear steps, payment options, verification tips, and solutions for common withdrawal issues.

Explore QXBroker.com in detail for Indian traders 📈! Learn about platforms, accounts, security, and support to trade confidently and wisely in India 🇮🇳.
Explore QX trading 📊 with insights on concepts, tools, strategies, risks, technology, and regulations—practical guidance for traders in the Indian market.
Based on 9 reviews