

Asia Composite Index Live Chart Explained
📈 Understand the Asia Composite Index live chart, key Asian markets, real-time trends, factors affecting stocks, and trusted sources to track investments smarter.
Edited By
George Foster
The Asia Composite Index chart distils the performance of multiple Asian markets into a single visual, helping investors track regional market trends with ease. This chart aggregates data from diverse economies like China, Japan, South Korea, India, and ASEAN countries, giving a broad perspective on Asia’s economic pulse.
Unlike single-country indices, the Asia Composite Index reflects collective movements across sectors and nations, exposing patterns that individual indices might miss. For instance, an investor tracking the Nifty50 alone may overlook how trade tensions between China and the US impact neighbouring markets. The composite index chart fills this gap.

Key components often include weighted shares from major stock exchanges such as the Bombay Stock Exchange (BSE), Tokyo Stock Exchange (TSE), Shanghai Stock Exchange (SSE), and others. Each country’s market contributes based on its market capitalisation size, ensuring more influential economies carry proportional weight. For example, China and Japan typically command a significant share of the index, reflecting their economic heft in Asia.
Being aware of the Asia Composite Index’s composition helps you make informed decisions, especially when analysing cross-border investment risks or spotting emerging opportunities in fast-growing Asian markets.
The chart’s trends can hint at broader economic shifts. A steady rise across the composite might signal increasing investor confidence in Asia’s growth prospects, while sharp declines could warn of troubles such as currency depreciation or geopolitical tensions. Traders often use this data alongside news on RBI policy changes, China’s manufacturing output, or Japan’s export figures to validate market direction.
To interpret the chart effectively, understand technical indicators like moving averages or RSI (Relative Strength Index) applied to the composite data. These help clarify momentum and potential reversal points. For example, if the composite crosses above its 200-day moving average, it often suggests bullish sentiment across Asia’s markets.
Understanding the Asia Composite Index chart equips investors and analysts with a consolidated view, enabling smarter allocation of funds and quicker reaction to emerging trends across the continent. With tools like real-time charting platforms and economic calendars, staying updated on this index is easier than ever.
The Asia Composite Index chart offers a snapshot of how stock markets across the Asian continent are performing collectively. It's a tool that sums up market movements in a single view, helping investors, traders, and analysts gauge regional economic health at a glance. This index itself reflects the combined performance of key stock exchanges from various Asian economies, making it a valuable reference for understanding broader market sentiment beyond individual countries.
The Asia Composite Index is a financial benchmark that aggregates stock price movements from multiple Asian markets to provide a comprehensive measure of the region's equity performance. Its purpose is to simplify the complexity of numerous individual markets into one coherent index, allowing market participants to track trends and make informed decisions about investment strategies in Asia as a whole.
This index typically includes major economies like Japan, China, South Korea, Hong Kong, Singapore, Taiwan, and India, among others. Including a range of developed and emerging markets means the index captures diverse economic cycles and sectoral trends across Asia. For instance, the strong tech sector in South Korea and Taiwan can balance the commodities-focused markets of India and China, providing a balanced regional perspective.
Unlike single-country indexes like the Sensex in India or the Nikkei in Japan, the Asia Composite Index blends multiple markets, offering broader exposure. It differs from pan-Asia indexes, such as the MSCI Asia ex-Japan, by including specific market selections and weightings based on market capitalisation and liquidity. This makes it a more tailored reflection of Asia's equity markets—especially useful for investors interested in regional trends rather than a single nation.
The index chart is divided across key sectors such as technology, financial services, consumer goods, energy, and healthcare. This breakdown helps investors identify which sectors are driving the market and spot emerging trends. For example, a surge in the technology segment on the chart might indicate strengthening innovation or demand in countries like Taiwan and South Korea, influencing sectoral allocation decisions.
Each country’s contribution to the index is weighted based on its market size and liquidity. India and China often carry significant weight due to their large economies and stock market capitalisation. This means strong economic data or corporate earnings from these countries can disproportionately impact the index movement, so investors must consider these weightages when analysing the chart.
The index relies on data collected from participating stock exchanges and financial data providers, ensuring timely and accurate price updates. Compilation involves adjusting for currency differences, market holidays, and varying trading hours across countries. Such methods ensure a fair representation of Asia’s market dynamics, allowing the index to reflect true market performance without biases caused by external factors.
Understanding these elements helps market watchers interpret the Asia Composite Index chart more effectively, providing a clearer picture of where Asian markets stand and guiding better investment choices.
Understanding how to read and analyse the Asia Composite Index chart is key to navigating the complexities of Asian markets. This chart visually summarises market performance across diverse economies, helping investors and traders identify trends, make informed decisions, and gauge market sentiment effectively. Without grasping its core elements, one might miss crucial signals or misinterpret data leading to missed opportunities.
Price movements reflect how the index value changes over time. Watching these trends helps investors spot momentum or reversals. For instance, a steady upward movement over weeks may suggest growing investor confidence across Asian economies. Conversely, sharp dips can signal sudden sell-offs tied to events like policy shifts or geopolitical tensions. Tracking moving averages can smooth short-term volatility and highlight the overall trajectory.
Volume shows the number of shares or contracts traded over a period and serves as a confirmation tool. High volume during price increases suggests strong buying interest, reinforcing a bullish trend. On the other hand, rising prices with low volume might point to a weak rally vulnerable to reversal. For example, if the Asia Composite Index spikes but volume stays low, caution is advisable as the move may lack broad market support.
Identifying technical patterns like head and shoulders, double tops, or flags can signal potential trend shifts. In the Asia Composite Index, spotting such patterns helps anticipate where the market might head next. Suppose a double bottom forms after a downtrend; it may indicate the start of a recovery phase. While these patterns do not guarantee outcomes, they give traders a framework for timing positions.

A bull phase shows rising prices with optimism, whereas a bear phase reflects falling prices and caution. The Asia Composite Index chart reveals these phases through sustained moves above or below key levels like support or resistance. For instance, when the index breaks above its 200-day moving average and holds, it's a good sign of a bull run. Recognising these phases aids in aligning strategies—buying during bulls and hedging during bears.
Using chart signals such as breakout points or pullbacks helps determine when to enter or exit trades. A breakout above resistance with strong volume might suggest a good entry to ride upward momentum. Conversely, a failure at resistance or a breakdown below support could call for an exit to limit loss. For example, Indian investors watching the Asia Composite Index can plan entries when the index shows sustained gains tied to expansion in regional trade.
Charts reflect past and current data but cannot predict sudden events like geopolitical crises or natural disasters. Relying solely on technical analysis may overlook broader economic changes such as shifts in monetary policy or currency fluctuations. Besides, regional diversity means different markets within the index may behave unevenly. Therefore, pairing chart analysis with fundamental research and staying updated on news is crucial.
Reading the Asia Composite Index chart equips investors with a practical tool for spotting market rhythms, yet it should be part of a broader strategy involving economic awareness and risk management.
In summary, learning to interpret the chart’s price trends, volume, and technical patterns offers a hands-on way to track market health and time investments. Keeping in mind its limits and combining it with news and data will help you make well-rounded decisions in Asia's dynamic markets.
The Asia Composite Index reflects the varied economic and political climates across Asia, making it essential for investors to understand the factors shaping its movements. Economic policies, trade dynamics, currency shifts, and geopolitical events all leave a mark on this index. These elements not only affect price trends but also influence risk perceptions and investment strategies.
Monetary policies, like interest rate adjustments by central banks such as the Bank of Japan or the Reserve Bank of India, directly influence market liquidity and borrowing costs. For instance, a rate cut by the RBI could encourage investment and consumer spending, boosting market confidence reflected in the index. Similarly, fiscal measures—government spending or tax reforms—affect economic growth expectations. China’s recent infrastructure stimulus is a good example, which has helped revive market sentiment in that region.
Trade policies, including agreements and tariffs, shape business prospects across borders. The Regional Comprehensive Economic Partnership (RCEP), involving several Asian countries, aims to lower trade barriers, which can enhance export-driven companies’ valuations reflected in the index. Conversely, tariff increases or trade tensions, like those between China and the US, tend to spook investors and cause volatility. Investors tracking the Asia Composite Index should watch these developments closely, as they can significantly impact sector-level and overall market performance.
Changes in exchange rates play a big role, especially since the index aggregates markets using different currencies. For example, a weakening Indian rupee against the US dollar might deter foreign investors, even if Indian companies are fundamentally strong. Currency swings also affect multinational companies' earnings when converted back to home currencies. Hence, understanding forex trends helps interpret index moves more accurately and assess risks associated with currency exposure.
Politics matter a lot for market expectations. Elections or changes in government bring uncertainty until policies clarify. The recent general election in Indonesia saw cautious market behaviour until it became clear investor-friendly policies would continue. Stable political environments generally support steady investment flows, while instability tends to cause sudden sell-offs or hesitations in the Asia Composite Index.
Conflicts, even if localised, create ripple effects. Tensions in regions like Kashmir or the South China Sea can unsettle investor sentiment across Asia. Markets may react strongly to news of escalations or ceasefire agreements, creating spikes or dips in the index. Though not all conflicts directly affect all countries’ markets, their potential to disrupt trade routes and supply chains means investors need to monitor geopolitical flashpoints.
Broader events like pandemics, oil price shocks, or financial crises elsewhere may heavily influence Asian markets. The Covid-19 pandemic, for example, disrupted supply chains and dampened demand, which the Asia Composite Index highlighted through steep declines. Similarly, a sudden shock in the US or European markets often triggers Asian market corrections due to global interconnectedness. Such events remind investors that factors outside Asia can still sway the index significantly.
Staying tuned to economic policies and geopolitical changes across Asia shapes better understanding of the Asia Composite Index to make timely investment choices.
By keeping these factors in mind, traders and investors gain a fuller picture of what moves the Asia Composite Index beyond just market charts and price actions.
Tracking the Asia Composite Index (ACI) effectively requires access to reliable tools and data sources. These resources help investors and analysts interpret market movements, spot trends, and make informed decisions. Practical tools not only deliver real-time data but also offer analytical features that simplify complex market behaviour.
Stock exchanges like the Singapore Exchange (SGX), Hong Kong Exchanges and Clearing (HKEX), and Tokyo Stock Exchange (TSE) provide official data for the Asia Composite Index. These platforms publish up-to-date index values, historical charts, and sector breakdowns, which are crucial for accurate tracking. For instance, the SGX often acts as a starting point for Asian market trends, reflecting regional sentiment before domestic markets open.
The direct availability of such data from exchanges enhances reliability compared to third-party sources. Investors can cross-check figures and confirm market status against these official platforms, avoiding pitfalls related to delayed or inaccurate updates.
Financial news portals such as Moneycontrol, Economic Times Markets, and Bloomberg Quint offer timely updates on the Asia Composite Index alongside expert commentary. Mobile apps from these providers allow users to track index movement on the go, receive alerts for significant changes, and follow related economic news that might impact the index.
Such platforms are handy for blending raw index data with contextual insights. For example, receiving push notifications about policy changes in China or election results in South Korea can provide immediate hints on potential index volatility, helping investors stay ahead.
Advanced tools like TradingView, MetaTrader, and specialized platforms from Indian brokers (Zerodha Kite, Upstox Pro) offer interactive charts of the Asia Composite Index. These tools come with technical indicators such as moving averages, Relative Strength Index (RSI), and Bollinger Bands, aiding traders in spotting trend reversals or momentum.
This analytical layer is essential for timing investments accurately. A trader spotting a double bottom pattern on these charts may decide to enter early, while another might use volume spikes to validate breakout moves. Such integrations turn raw data into actionable strategies.
Customisable alerts on platforms help investors receive real-time updates about specific index levels or percentage changes. For example, an alert on a 2% dip or rise in the Asia Composite Index can prompt timely portfolio review or hedging actions.
This reduces the risk of missing critical market moves, especially when managing diversified assets. Investors using these alerts can react quickly rather than continuously monitoring the markets manually.
Integrating index charts with macroeconomic data such as GDP growth rates, inflation figures, and foreign exchange trends helps investors understand broader market drivers. For instance, a rise in the Indian Rupee against the US Dollar alongside the Asia Composite Index movement could signal favourable conditions for Indian exporters.
Such integration places index trends in context, supporting more nuanced investment decisions that consider macro-level forces.
Chart analysis enables risk control through stop-loss settings, position sizing, and diversification monitoring. Investors can set thresholds based on chart support and resistance levels of the Asia Composite Index to limit downside.
In addition, monitoring sector shifts within the index over time helps identify emerging risks or opportunities. For instance, a heavy tilt towards technology stocks in the index may increase volatility risk, prompting adjustments in portfolio allocation.
Effectively combining these tools and data sources leads to better-informed investment strategies and reduces exposure to unexpected market swings.
Leveraging practical tools to track the Asia Composite Index is no longer optional—it's necessary for anyone serious about Asian market investments.
Understanding the Asia Composite Index is particularly useful for Indian investors seeking to broaden their perspective beyond local markets. Trends observed in this index often hint at larger economic shifts in Asia, which directly or indirectly influence Indian equities, currencies, and investment strategies. India's growing trade ties and economic interactions with neighbouring Asian economies make following this index a practical tool for anticipating market behaviour.
The Asia Composite Index often shows a moderate to strong correlation with Indian benchmarks like Sensex and Nifty, especially when global or regional economic factors affect multiple markets simultaneously. For example, a slowdown in China can weigh on manufacturing supply chains, which then ripple through to Indian industrial and IT stocks. Tracking this correlation helps Indian investors gauge broader market sentiment and calibrate portfolio exposure accordingly.
Certain sectors, like technology, banking, and consumer goods, show considerable overlap between the Asia Composite Index and Indian markets. Yet, divergences occur due to policy differences or domestic economic conditions. For instance, while Indian banking stocks may rally on domestic reforms, the same sector might face headwinds in another Asian economy due to regulatory tightening. Recognising these nuances aids investors in spotting opportunities in sectors outperforming within Asia while mitigating risks from those lagging.
The index reveals both fresh investment avenues and potential hazards for Indian investors. Rapid growth in markets like Vietnam or Indonesia, often included in the Asia Composite Index, presents diversification possibilities beyond established economies like China or South Korea. Conversely, geopolitical tensions or currency volatility in certain regions can heighten risk. Indian investors who monitor these fluctuations through the index can position themselves to benefit from emerging trends while hedging against sudden downturns.
Using the Asia Composite Index data encourages diversification beyond India's borders. Investors can allocate funds to sectors or countries within Asia that demonstrate promising growth or resilience, thereby reducing concentrated risks tied to the Indian economy alone. Mutual funds and exchange-traded funds (ETFs) tracking Asian markets are practical vehicles to tap such diversification.
Trend signals from the Asia Composite Index help Indian investors identify optimal entry and exit points. For example, sustained uptrends in the index might suggest favourable sentiment and growth prospects in Asian economies, signalling a good time to expand exposure. Conversely, warning signs such as sharp corrections or increased volatility can prompt cautious rebalancing or profit booking.
Currency fluctuations significantly impact returns when investing across Asian markets. Movements in INR versus other Asian currencies can either enhance gains or deepen losses. Similarly, investors must stay alert to regulatory changes like foreign investment limits or tax reforms in key Asian countries. Integrating such factors with chart analysis ensures a more rounded decision-making process.
Indian investors benefit by studying the Asia Composite Index not just for its direct market insights but also for its ability to reveal regional shifts affecting domestic portfolios. Keeping an eye on this index alongside currency and policy developments offers a more comprehensive investment outlook.
📈 Understand the Asia Composite Index live chart, key Asian markets, real-time trends, factors affecting stocks, and trusted sources to track investments smarter.
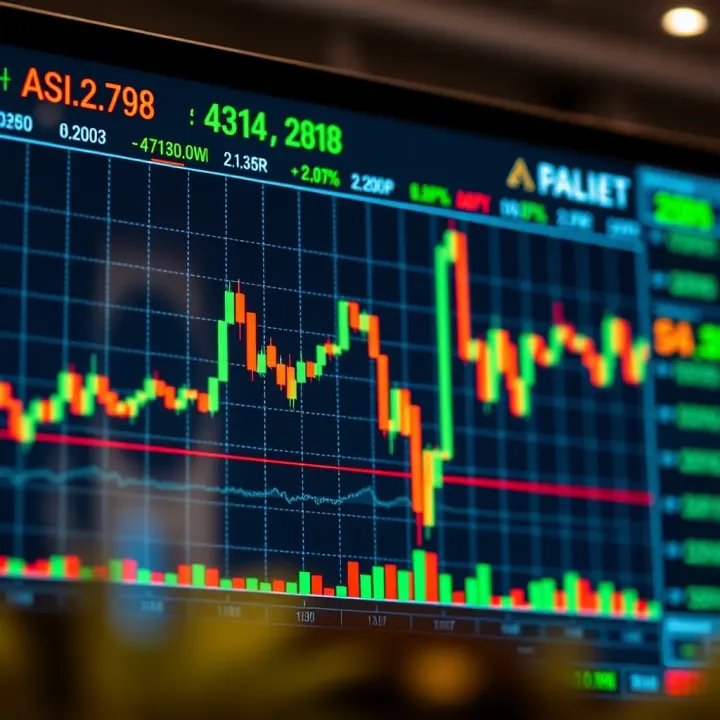
📈 Get real-time insights on the Asia Composite Index live chart, understand its components, track market trends accurately, and make informed investment decisions today.

📈 Understand the Europe Composite Index, track live chart movements, explore key factors shaping the market, and get tips for smart investing in European stocks.

Explore trends and challenges in India's crib market 🍼, key players, consumer behaviour, and future opportunities for buyers and retailers alike.
Based on 8 reviews